
Explore Costs
See LLM spend by operation type — extraction API, manual run, scheduled run — over 7, 30, or 90-day windows.
Cost Explorer answers one question: where did my LLM money go? It pulls from the same usage logs that record every model call you've made — Extract API calls, manual test runs, scheduled test runs, and the pre-populate flow — and lets you slice by time window and operation type.
What you'll see
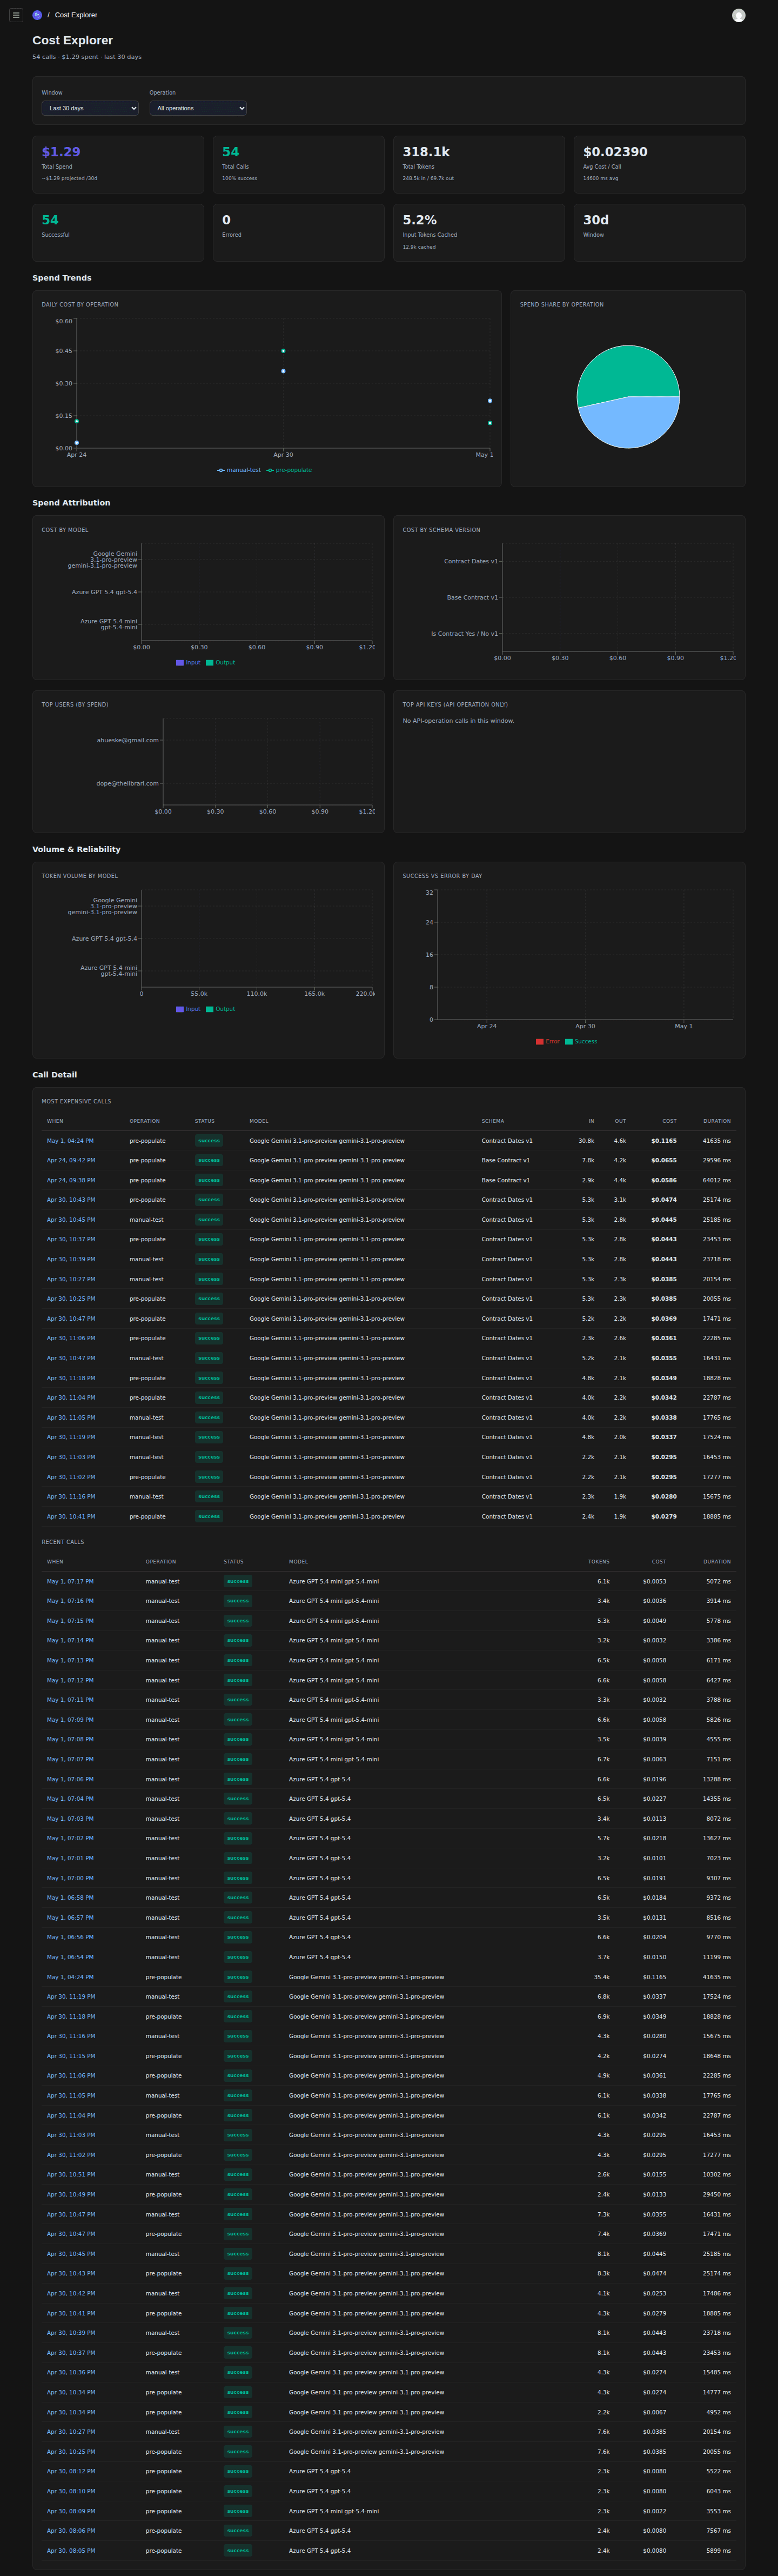
- Window selector (default: Last 30 days)
- Operation selector (default: All operations)
- Top-line spend / calls / tokens tiles
- Spend Attribution charts
- Per-call detail table
The two filters
- Window —
Last 7 days,Last 30 days, orLast 90 days. Anything older than 90 days isn't accessible here; if you need long-tail analysis, export from the underlyingllm-usage-logs(super-admin only). - Operation —
All operations(default), or one of:- Extract API — calls to the
/api/extractendpoint from your own applications. - Manual Test Run — extractions triggered from the Manual Test Run page.
- Scheduled Test Run — extractions triggered by the Scheduled Test Runs cron.
- Pre-populate — extractions kicked off by the ground-truth pre-populate flow (used while filling in Ground Truth Responses).
- Extract API — calls to the
What's in a populated view
Once you've made some extractions, the page shows:
- Spend totals for the selected window, broken down by operation type and by model deployment.
- Token totals (input and output separately, since output costs more).
- Trend chart over the window, so you can spot a sudden spend spike from a runaway scheduled run or a buggy app integration.
Common questions
- "Why is Extract API spend so high this week?" — switch Operation to Extract API, look at the model breakdown. Often a single deployment dominates because your app picked the most expensive one.
- "Which scheduled run is most expensive?" — switch Operation to Scheduled Test Run. If one schedule is dominating, consider running it on a smaller test set or a cheaper model.
- "Did I get billed for a manual experiment last week?" — set Window to Last 30 days, Operation to Manual Test Run. Yes, you did.
What's not here
- Costs for non-LLM operations — OCR, storage, etc. — aren't tracked here.
- Costs broken down by individual user. Cost is rolled up at the account level.
Related
- Run a Manual Test — the most likely source of a budget spike while you're iterating.
- Schedule Recurring Tests — the most likely source of recurring spend; tune cadence + test-set size to match the value you're getting.
- Browse Supported LLM Models — to compare per-million pricing before picking a model.
Browse Supported LLM Models
See which model deployments are wired up for runs and the Extract API, which are chat vs embedding, with per-deployment pricing and limits.
Manage Extraction API Keys
Create and revoke bearer tokens for the public /api/extract endpoint your applications call to get structured data out of documents.