
View Test Analytics
Compare model accuracy, cost, and latency over time, by field, by document, and head-to-head — across every benchmark you've run.
Every manual run and scheduled run writes a Test Result Set — a record of what was tested (schema version × model deployment × test set), and what came out (per-field scores, per-document scores, total cost, total latency). Test Analytics is where you read those.
If you've never run anything yet, you'll see the empty state shown below. The view comes alive once you have a few result sets to compare.
What you'll see
1. Open Test Results
Click Test Results in the admin sidebar (the URL is /admin/test-analytics). With benchmarks under your belt, the page is dense with charts and a per-run table:
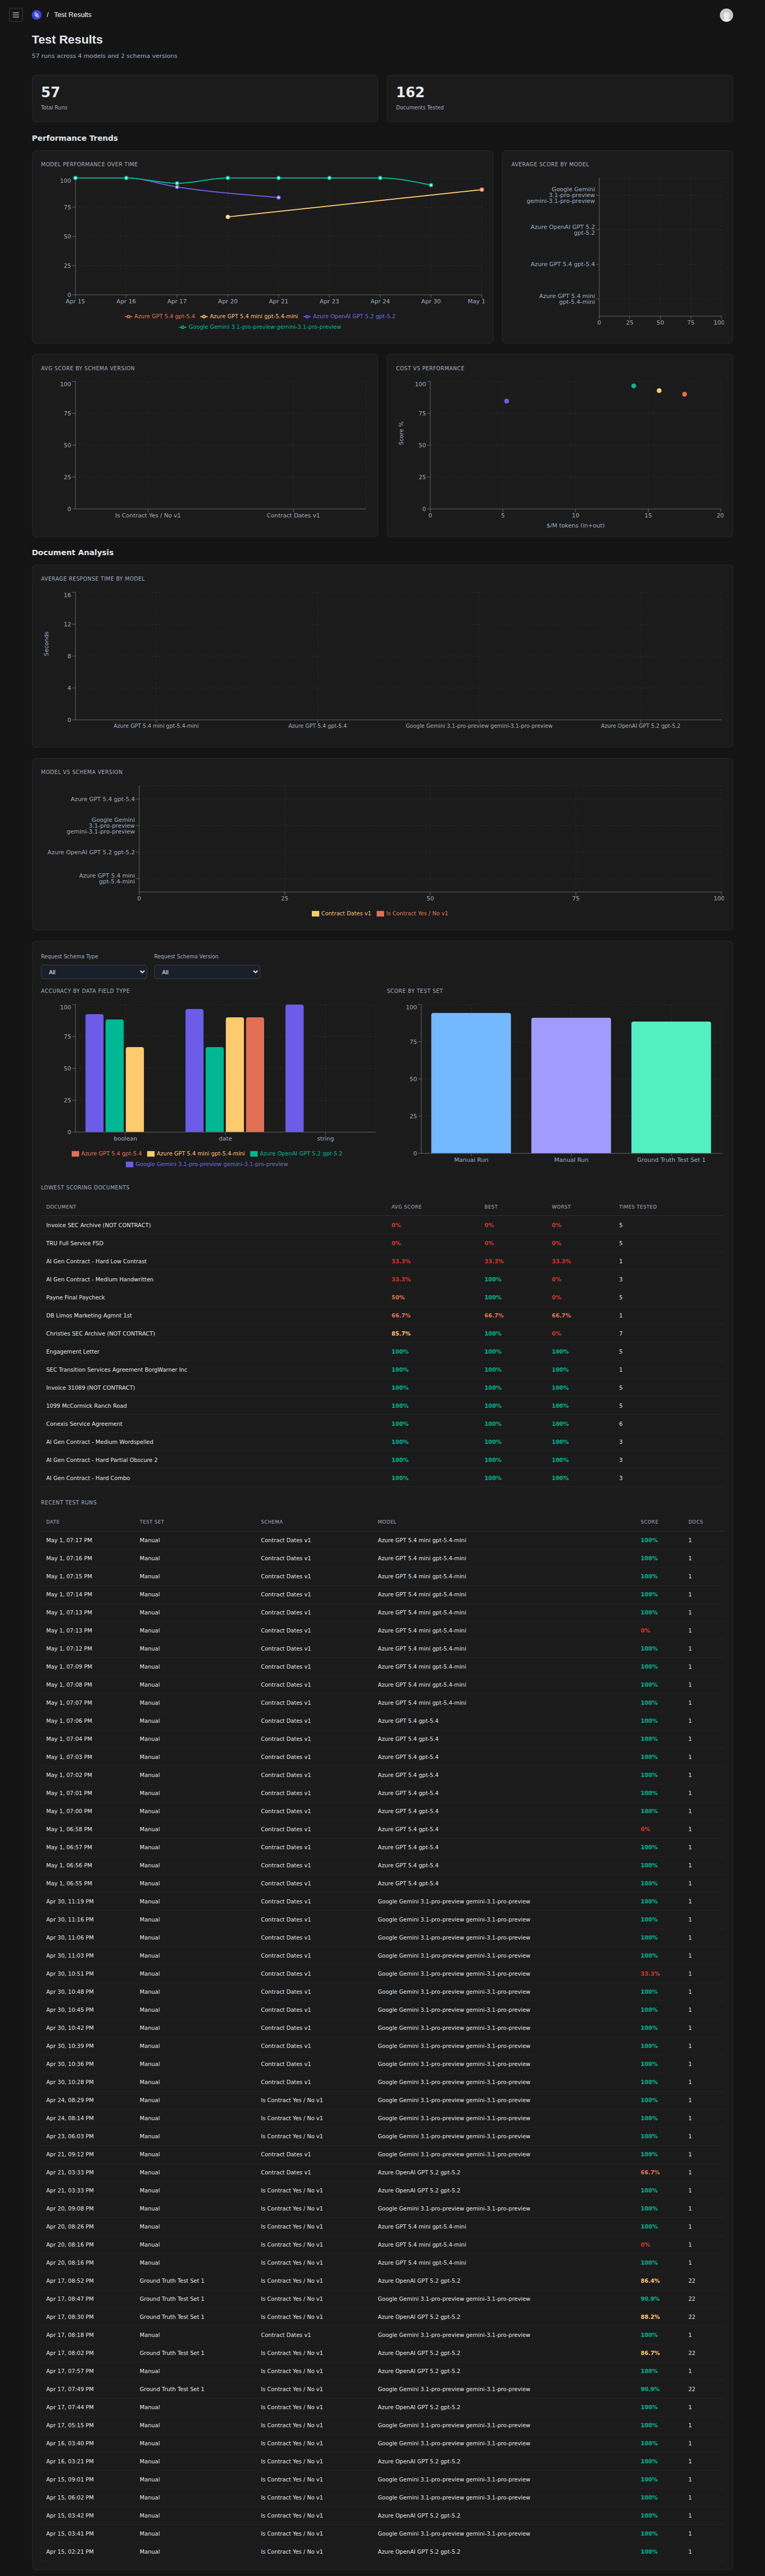
- Top-line counters (test runs / documents tested)
- Performance Trends — accuracy over time
- Side-by-side model comparison bars
- Per-run Call Detail table
Brand-new accounts see an empty-state version of the same page until the first run lands. The fix is upstream: go run a manual test or set up a scheduled run.
What's in a populated view
Once you've run benchmarks, the populated Test Analytics view lets you:
- Filter by Schema Version, Model Deployment, Test Set, Document Type to scope the charts and table to whatever question you're asking (e.g. "show me only GPT 5.4 runs against the General Contract test set").
- See accuracy over time for that filter, so you can spot the day a provider model was silently updated and quality dipped.
- Compare models head-to-head on the same test set + schema version: see which model wins overall and which fields each model is better/worse at.
- Drill into per-field scoring to find out which fields a model gets wrong, not just that it's wrong somewhere.
- Drill into per-document scoring to find the specific documents that broke a run — usually the most informative thing to look at.
- See cost and latency alongside accuracy. A model that's 1% better and 10× more expensive may not be the right pick.
How scores are computed
Each extracted field is compared against the matching field in the published Ground Truth Response for that document × schema-type pair. Comparison is type-aware:
- Strings, enums, dates — exact-match after normalization.
- Numbers — exact-match for integers; configurable tolerance for decimals.
- Objects, arrays — recurse, and roll up.
Per-field correctness counts. Field-level scores roll up into per-document scores; document-level scores roll up into the test result set's overall accuracy. These are the machine's verdicts — when it gets one wrong, you can override it field by field (see below).
Override a field's grade
Sometimes the auto-scorer is wrong: a wrong that's really a formatting nitpick you'd accept, or a correct that was a fluke. You can correct it after the fact.
Drill into the per-document scoring and open the Test Result Document. It has a Field Scoring section listing every field with a Correct checkbox and the original verdict (correct, wrong, missing). Tick or untick to override — the score badge updates live and shows (unsaved) — then click Save & Re-score. The document's score is recomputed from your overrides (each field keeps its weight; you're only flipping correct vs. not), and the parent Test Result Set is re-averaged. You'll see Re-scored and saved. when it's done.
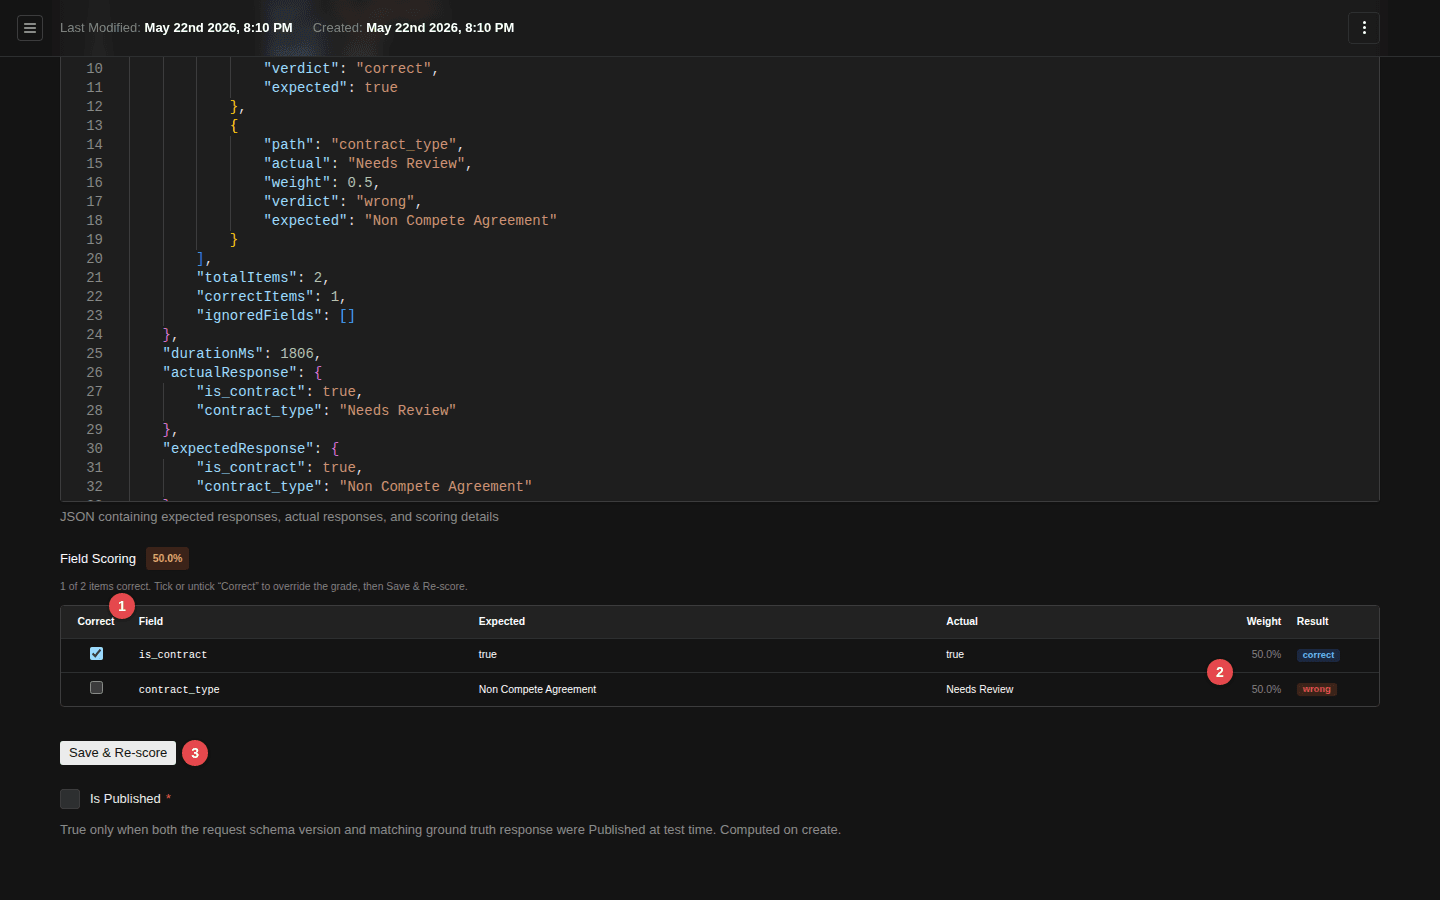
- Correct checkbox — tick or untick to override each field's grade
- The field the auto-scorer marked wrong (expected vs. actual disagree)
- Save & Re-score — recomputes this document and re-averages the set
This is the same override you can do inline right after a manual run — it just works on saved results too, any time after the fact. Any signed-in user can do it, on documents in their own tenant.
Common questions
- A model "got better" overnight — what changed? Check whether a new schema version was published. The result set is keyed by
(schema version × model deployment × test set), so a v2 and a v1 of the same schema produce separate rows. Compare them side by side. - A model "got worse" overnight — what changed? Same trick, in reverse: confirm you're comparing apples to apples. If you are, you've probably caught a silent provider-side model update — exactly what scheduled runs are for.
- One document drags the whole average down. Drill in. The document might genuinely be hard, or its ground-truth response might be wrong. Either is useful to know.
Related
- Run a Manual Test — produces the result sets you read here.
- Schedule Recurring Tests — keeps producing them while you sleep.
- Explore Costs — when the question is dollars, not accuracy.
Schedule Recurring Tests
Set up cron-style runs that benchmark a schema/model pair against a test set on a schedule, so quality regressions get caught before users do.
Browse Supported LLM Models
See which model deployments are wired up for runs and the Extract API, which are chat vs embedding, with per-deployment pricing and limits.